10. AI Data Assistant
10.1 Overview of the HISPMD AI Data Assistant
The HISPMD AI Data Assistant enables users to interact with Ethiopia’s health indicator data using natural language queries. Designed as a rule-based chatbot, this assistant simplifies data exploration without requiring technical skills.
Though it leverages a chatbot-style interface, no AI or machine learning is used. The system is built using Streamlit for the UI and SQLAlchemy for structured database queries, ensuring a focused and reliable tool for HISPMD indicator data.
Key Benefits
- User-Friendly: Ask questions in plain language to get quick insights.
- Accessible: No coding required — works entirely within a web browser.
- Custom Visualizations: Request charts like bar, line, and pie charts using simple commands.
- Ethiopia-Specific: Works exclusively on HISPMD data and follows national HIS indicator standards.
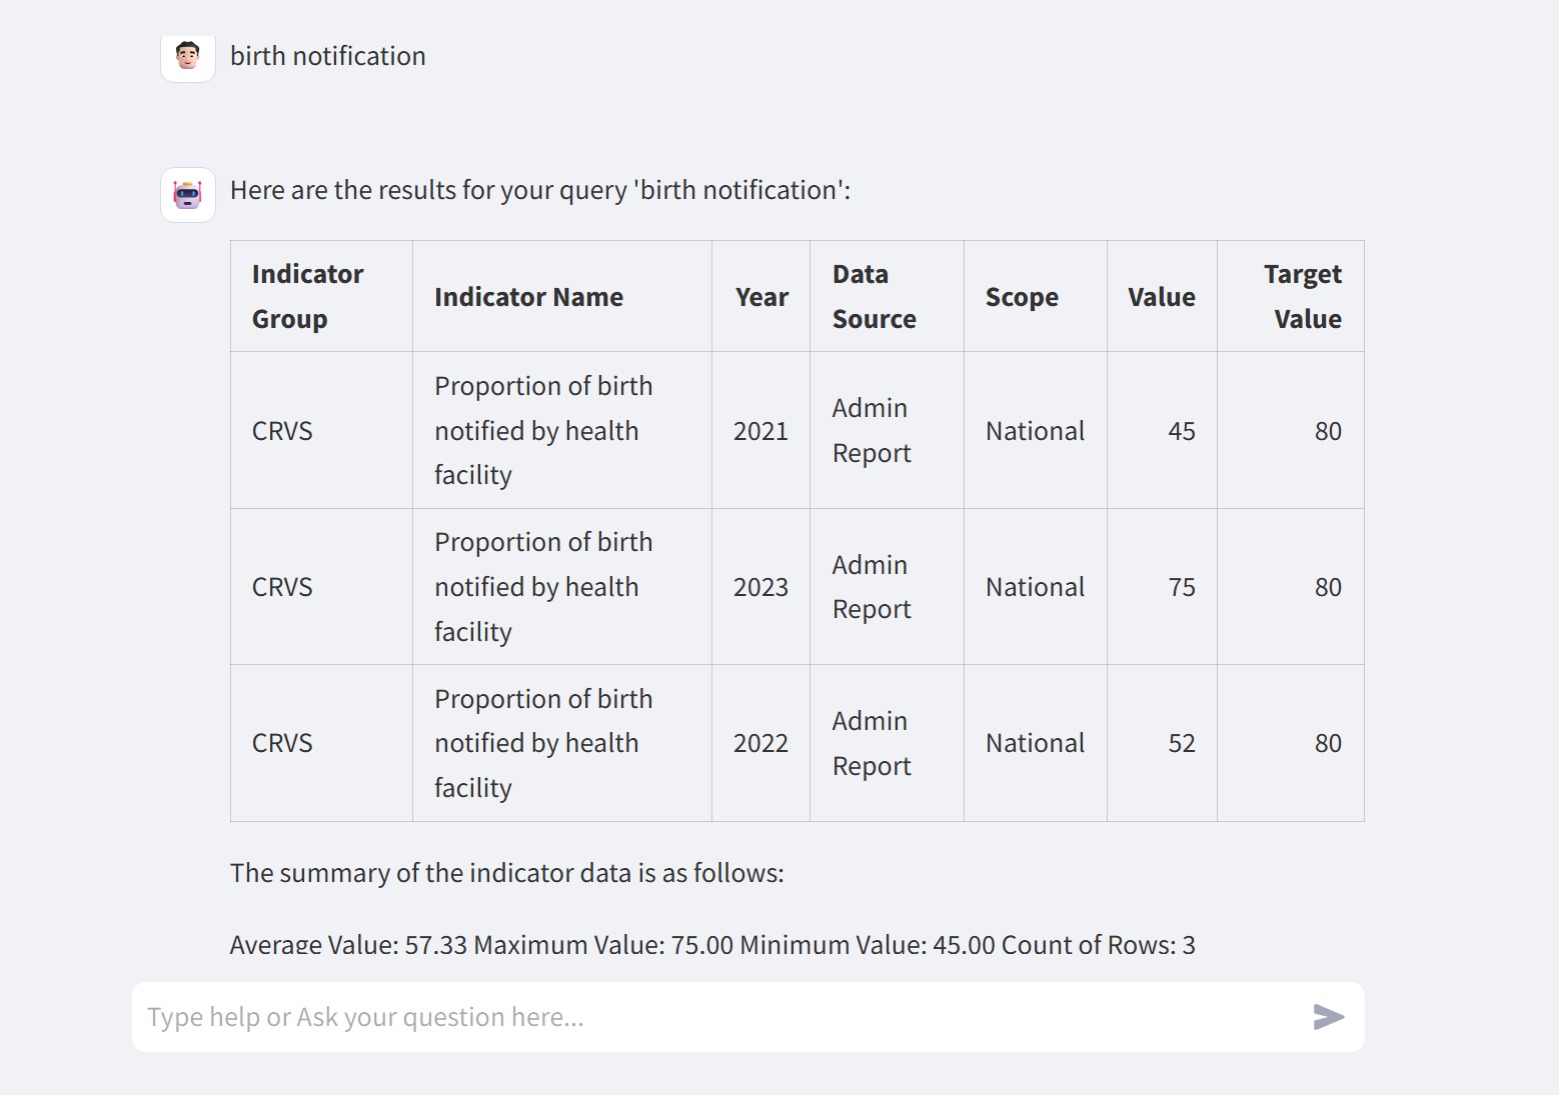
Figure 10.1: Example of AI Data Assistant responding to user queries
10.2 How to Use the AI Chatbot
🧭 Steps to Start
- Open the AI Data Assistant module from the HISPMD dashboard.
- Type your question in the input field.
- Get instant responses based on the current HIS indicator data.
✅ Example Questions You Can Ask
| Type | Example Queries |
|---|---|
| Greetings & Basic | “Hello”, “Hi”, “List all data” |
| Summary Statistics | “How many indicators are there?”, “What is the average value of [Indicator Name]?” |
| Aggregations | “What is the sum of [Indicator Name]?”, “Show unique indicators” |
| Insight by Indicator | “Give me a summary of [Indicator Name]”, “What is the value of [Indicator Name] in the year [Year]?” |
| Extremes | “Show the lowest value for [Indicator Name]”, “Show the highest value for [Indicator Name]” |
10.3 How to Generate Charts
The chatbot supports visualizations that summarize indicator trends using natural queries.
📊 Supported Chart Types
| Chart Type | Example Query |
|---|---|
| Bar Chart | “Show a bar chart of reporting timeliness by year” |
| Line Chart | “Show a line chart of birth notification by year” |
| Area Chart | “Show an area chart of reporting completeness by year” |
| Pie Chart | “Show a pie chart of woredas by data source detail” |
| Horizontal Bar Chart | “Show a horizontal bar chart of reporting completeness by Facility Type” |
| Combo Chart | “Show a combo chart of reporting timeliness by region for year 2024” |
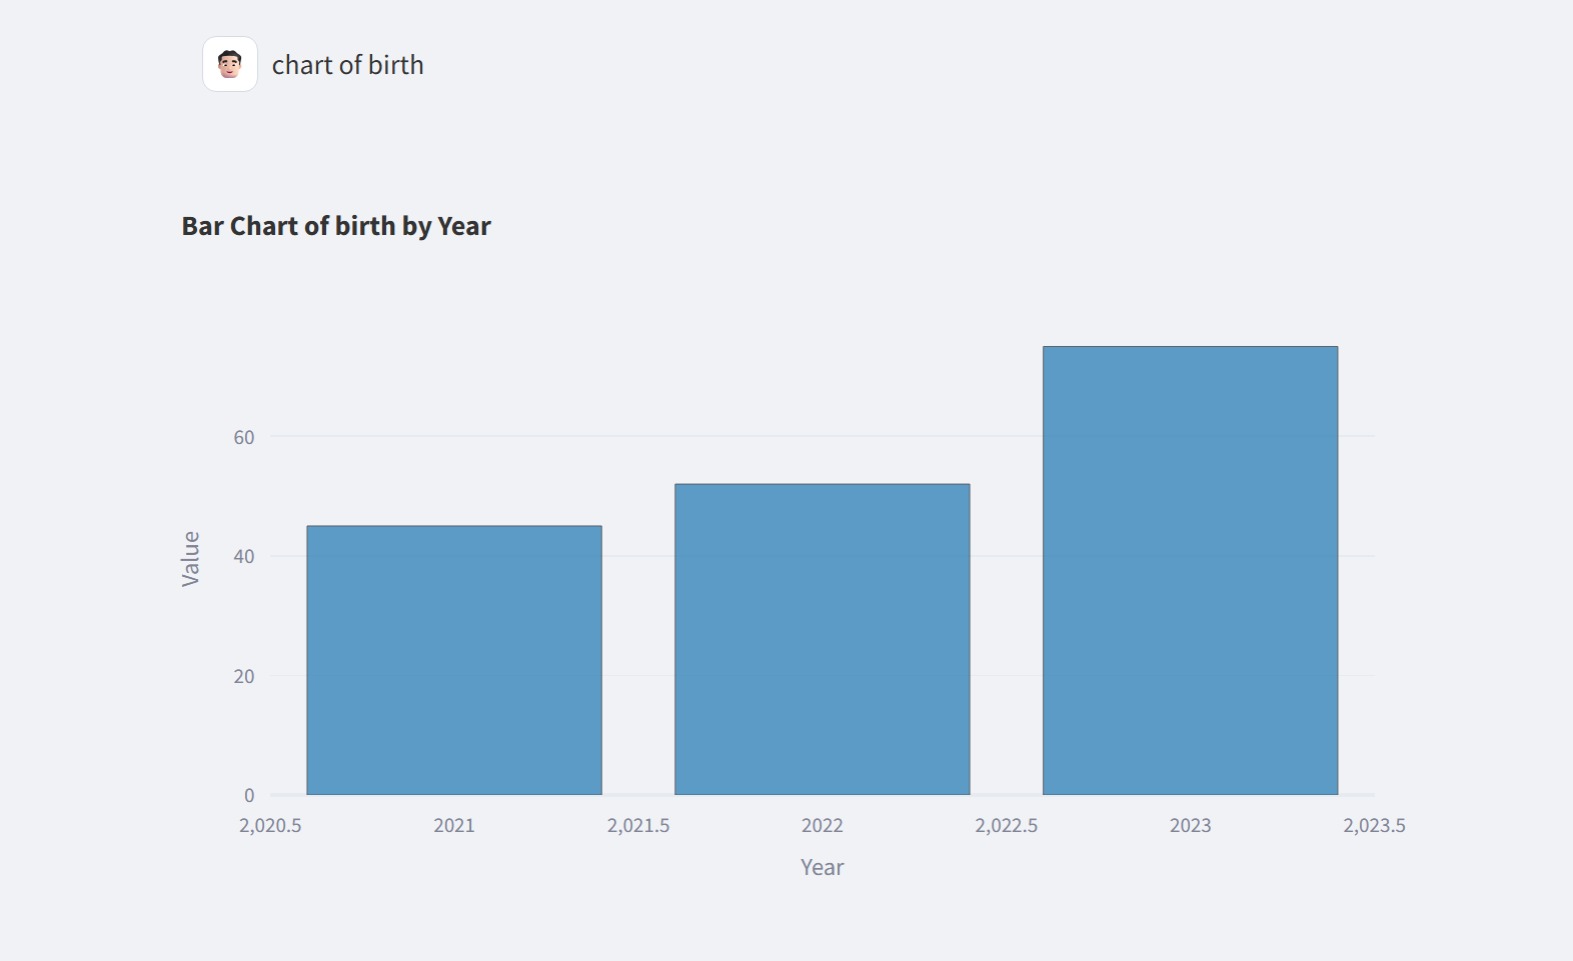
Figure 10.2: Example of a generated chart based on natural language input
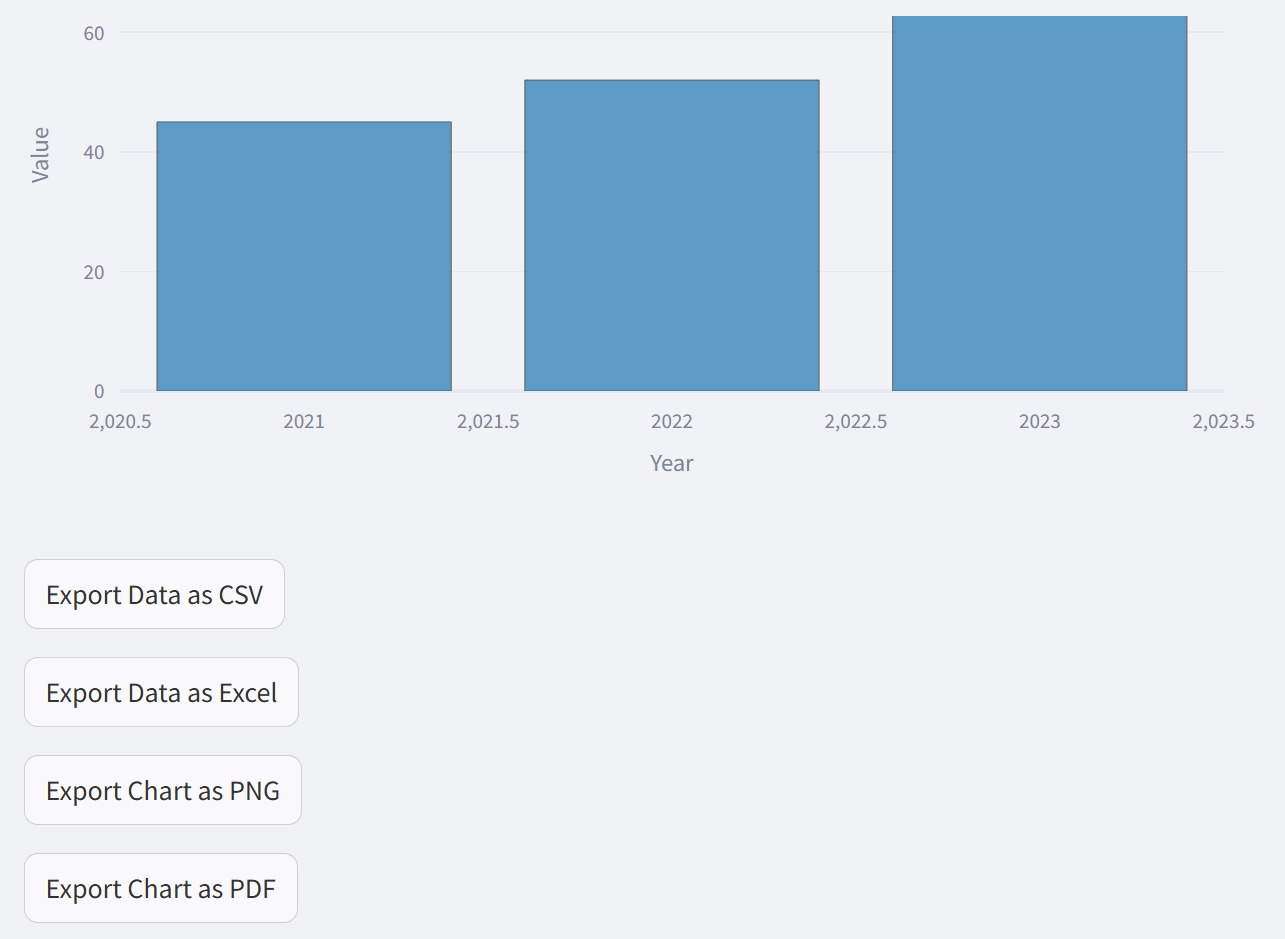
Figure 10.3: Example of a generated chart for exporting in various formats
10.4 About the AI Data Assistant
The HISPMD AI Data Assistant is a simple and efficient tool developed to enhance user interaction with Ethiopia’s Health Information System indicators.
🔍 Key Notes
- The assistant uses rule-based logic, not artificial intelligence or machine learning.
- Data interaction is made possible via SQLAlchemy.
- Built with Streamlit, ensuring an intuitive user experience.
10.5 Additional Info
ℹ Relevant Information
- The assistant is tailored only for HISPMD data.
- Developed and maintained by Information Systems & Digital Health Unit.
- For data-related questions, please contact the official support team.
10.6 Best Practices for Using the AI Assistant
| Best Practice | Why It Matters |
|---|---|
| Use clear indicator names | Ensures accurate data is retrieved. |
| Be specific in year or region queries | Helps generate more relevant charts and statistics. |
| Validate generated charts for accuracy | Visuals rely on HISPMD database — always double-check summaries. |
| Keep questions focused | One indicator per question yields best results. |
10.7 Summary of AI Data Assistant Features
- Natural Language Interface: Ask questions like “What’s the average value of reporting completeness?”
- Chart Support: Bar, Line, Pie, Area, Combo charts with simple text prompts.
- Data-Specific: Built exclusively for HISPMD’s indicator dataset.
- Rule-Based Engine: No machine learning used — responses are deterministic and based on data rules.
- Support Access: Developer and consultancy support available for questions and enhancements.
📌 Next Section: Learn how to manage your data securely in the User Management & Access Control module. 🔐
---
🛠 Developer Info
- Powered by: MERQ Consultancy
- Developer: Michael Kifle Teferra
- Contact: +251913391985
- LinkedIn: Michael K. Teferra
- Web: mikeintoshsys.com
- Telegram: @mikeintosh
- GitHub: MIKEINTOSHSYSTEMS
- Support Email: support@merqconsultancy.org