5. Indicator Analysis
5.1 Overview of Indicator Analysis in HISPMD
Indicator analysis in the Health Information Systems Performance Monitoring Dashboard (HISPMD) allows users to assess health system performance based on key metrics. Indicators measure health outcomes, service coverage, and system efficiency, helping decision-makers:
- Evaluate progress toward health goals and targets.
- Identify gaps and areas requiring intervention.
- Compare performance across time, regions, and facility types.
- Support evidence-based decision-making.
HISPMD provides interactive tools to analyze and interpret indicator data, offering multiple views, filtering options, and comparisons.
5.2 Understanding Health Information Systems Indicators in HISPMD
Health Information Systems indicators in HISPMD are grouped into different Indicator Groups, each representing a critical aspect of health system performance. These include:
| Indicator ID | Indicator Name | Indicator Group | Indicator Short Name | Indicator Description |
|---|---|---|---|---|
| 1 | Number of health administration units with updated HIS strategic plan in place | HIS Governance | HIG_HFs with updated HIS strategic Plan (#) | Availability of HIS strategic plan assessed for all administrative units via PRISM, IR, or rapid assessments. |
| 2 | Proportion of health administration units with an annual costed comprehensive HIS plan | HIS Governance | HIG_HAUs with annual costed HIS plan (%) | Measures proportion of administration units (Regions and MOH) with a separate annual costed HIS plan. |
| 3 | Proportion of health administration units with an annual costed comprehensive plan where HIS is included | HIS Governance | HIG_HAUs with annual plan where HIS is part of the plan (%) | Measures proportion of units (ZHD and WorHO) with HIS integrated within a comprehensive plan. |
| 4 | Proportion of health administration units with a contextually adapted health sector strategic plan | HIS Governance | HIG_HAUs/RHBs with adopted HSTP (%) | Assesses adaptation of strategic documents at the regional health bureau level. |
| 5 | Proportion of health administration units with at least one functional HIS governance structure/coordination platform | HIS Governance | HIG_HAUs with functional governance structure (%) | Includes HIS Steering Committees, HIS NAG, and HIS Data Use TWG. |
| 6 | Proportion of health facilities and administration units with HIS structure staffed as per standards | HIS Structure and Resource | HSR_HIS structure staffed as per standard (%) | HIS staffing requirements for different administrative levels and facility types. |
| 7 | Number of HIS partners that have aligned their operational plan with the national HIS plan | HIS Governance | HIG_HIS partners with aligned plan (#) | Measures alignment of HIS project-funded partners’ budgets with HIS support. |
| 8 | Proportion of HIS/DH budget allocated out of the total health budget | HIS Governance | HIG_Budget allocated for HIS/DH (%) | Share of HIS/DH budget as a proportion of total health budget. |
| 9 | Utilization status of HIS/DH budget for the year | HIS Governance | HIG_HIS/DH budget utilization (%) | Measures efficiency in utilizing allocated HIS/DH budget. |
| 10 | HIS governance indexes | HIS Governance | HIG_HIS governance index | Includes sub-indicators like HIS legislations, policies, functional HIS governance, eHealth policy, etc. |
Each indicator has data points collected over time and can be analyzed based on administrative units, facility types, indicator groups, periods, data sources, and other relevant dimensions.
5.3 Navigating the Indicator Analysis Section
To access the Indicator Analysis module:
- Go to the HISPMD Dashboard and navigate to Indicator Analysis from the main menu.
- Select the Indicator Group you want to analyze.
- Choose specific Indicators from the dropdown list.
- Apply filters (e.g., year, region, facility type, data source).
- View data trends, comparisons, and distributions in tables, graphs, or maps.
5.4 Key Features of Indicator Analysis
HISPMD offers robust analytical tools tailored to Ethiopia’s health information system priorities:
📊 Trend Analysis (Time Series Analysis)
- Purpose: Tracks indicators’ progress over time to identify patterns or anomalies.
- Visualization: Line charts, bar charts.
- Example: Monitoring Digital Health Maturity Index (eCHIS) quarterly.
📍 Geographic Comparison
- Purpose: Compares indicators across administrative levels (Regions, Zones, Woredas).
- Visualization: Heat maps, bar charts.
- Example: Comparing health facilities’ verification factors (VF) for SBA across regions.
📈 Facility Type Comparison
- Purpose: Evaluates performance differences between hospitals, health centers, health posts, and administrative units.
- Visualization: Stacked bar charts, tables.
- Example: Comparing HIS workforce core competency index across facility types.
🔄 Benchmarking Against Targets
- Purpose: Assesses performance against national standards or global targets.
- Visualization: Progress bars, gauge charts.
- Example: Evaluating whether Ratio of HMIS vs. EDHS data for Penta 3 meets the acceptable range (90–110%).
5.5 Filtering and Customizing Indicator Data
HISPMD allows users to tailor analyses using flexible filters:
| Filter Option | Purpose | Example Use Case |
|---|---|---|
| Time Period | Select specific months, quarters, or years. | Compare HIS budget utilization in 2023 vs. 2024. |
| Region/Woreda | Drill down by administrative level. | Analyze Proportion of death notifications in Addis Ababa vs. Tigray. |
| Facility Type | Compare hospitals, health centers, health posts. | Assess EMR implementation rates in primary hospitals vs. specialized clinics. |
| Digital Health System | Filter by DHIS2, eCHIS, EMR, or CBHI status. | Identify regions lagging in DHIS2 dashboard updates. |
| Data Quality Status | Focus on facilities with high/low VF scores. | Target woredas with unacceptable SBA verification factors. |
How to Apply Filters: 1. Click Filters in the Indicator Analysis module. 2. Choose parameters (e.g., Region: Oromia, Facility Type: Health Center, Indicator: CRVS Birth Notification). 3. Click Apply to update visualizations.
5.6 Comparing Multiple Indicators
HISPMD enables cross-indicator analysis to uncover correlations and gaps:
Steps: 1. Open Indicator Analysis. 2. Click Add Indicator to include up to 5 indicators. 3. View combined trends in synchronized graphs or tables.
Example Comparisons: - Proportion of facilities with functional PMTs vs. Information Use Index to assess governance impact. - Digital Health Maturity Index (DHIS2) vs. Reporting timeliness to evaluate technology’s role in data quality.
5.7 Exporting and Reporting Indicator Analysis
Export data seamlessly for external use:
| Format | Use Case |
|---|---|
| Excel (XLSX) | Advanced analysis of HIS budget allocations. |
| Share CRVS notification trends with stakeholders. | |
| Image (PNG/JPEG) | Embed geographic comparisons in presentations. |
How to Export: 1. Click Export (📤) in the analysis panel. 2. Select format (e.g., PDF for HIS Strategic Plan Adoption Report).
5.8 Key Insights for Decision-Making
HISPMD helps to: - Prioritize investments in HIS workforce and digital health expansion. - Improve accountability in HIS budget utilization. - Enhance standards in medical record systems.
5.9 Best Practices for Indicator Analysis
- Disaggregate data by facility type to identify disparities.
- Benchmark against HIS targets for alignment with national goals.
- Monitor data quality using VF scores and LQAS compliance.
- Link governance and outcome indicators to measure impact effectively.
By integrating Ethiopia-specific indicators into HISPMD, users can drive evidence-based decisions, optimize health system performance, and accelerate progress toward national and global health goals. 🚀 Next Section: Learn to automate reports and share insights in Report Generation & Exporting.
5.10 Data Entry
The Data Entry module in the Health Information Systems Performance Monitoring Dashboard (HISPMD) allows users to input health indicator data efficiently. This feature ensures that collected data is accurately recorded and aligned with national and regional health reporting standards. This section provides a comprehensive guide to entering health information systems indicators data, including the various fields and attributes required for proper data submission.
5.10.1 MOH Indicator Data Entry
The Ministry of Health (MOH) Indicator Data Entry form enables users to enter performance data for various health indicators. Before entering data, ensure that you:
- ✅ Have the correct data values from the verified source.
- ✅ Understand the indicator definitions and reporting standards.
- ✅ Are authorized to submit data based on your user role and permissions.
Steps to Enter Data
- Navigate to the Data Entry Page:
- Click on "Data Entry" in the main menu.
-
Select "MOH Indicator Data" from the available data entry forms.
-
Fill in the Required Fields:
-
Carefully input the required information as detailed below.
-
Review Your Data:
- Verify the accuracy of the entered data.
-
Ensure values correspond to the correct Indicator Group, Data Source, Facility Type, and Period before submission.
-
Save the Data:
- Click the "Save" button to store the data in the system.
-
If you need to enter more records, select "Add New" and repeat the process.
-
Confirm Submission:
- After saving, a confirmation message will be displayed.
- You can review, edit, or delete the record if needed before finalizing it.
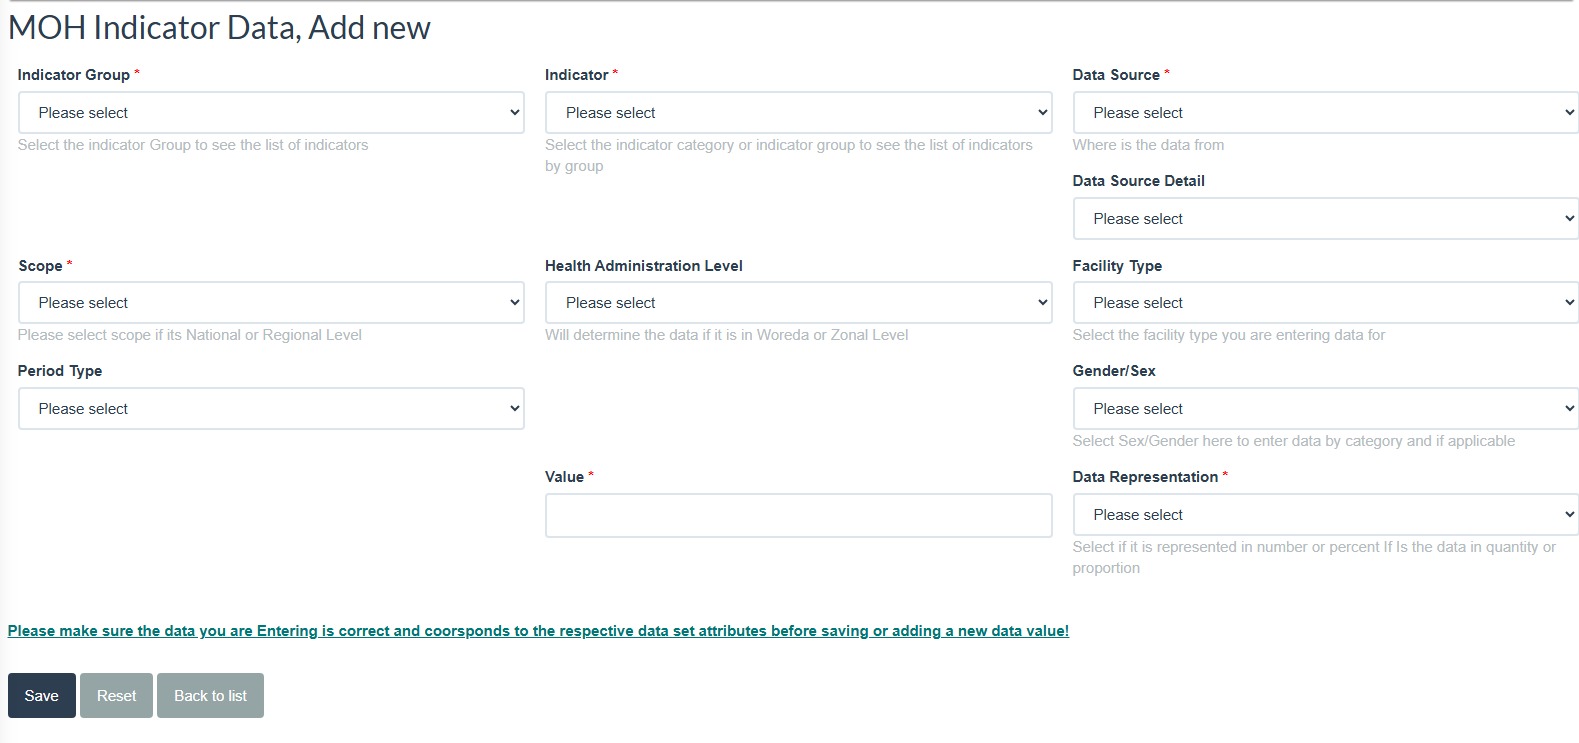
Figure 5.1: Adding New Indicator Data
5.10.2 Data Entry Fields and Attributes
Each data entry field plays a crucial role in ensuring data accuracy and proper categorization. Below are the required fields, their descriptions, and the selection process.
- Indicator Group
- 📌 Field Name: Indicator Group
-
🛠️ Selection Type: Dropdown Select the Indicator Group from the available options. Example groups: HIS Governance, Data Use, Data Quality, Digital Health, IR Pathway, CRVS, HIS Structure and Resource.
-
Indicator
- 📌 Field Name: Indicator
-
🛠️ Selection Type: Dropdown Select the Indicator you want to enter data for. Example indicators: Ratio of HMIS versus EDHS data - SBA, Reporting Timeliness - Service Report, Birth and Death - Report, etc.
-
Data Source
- 📌 Field Name: Data Source
-
🛠️ Selection Type: Dropdown Identify where the data originates from (e.g., health facility reports, surveys, electronic health records, administrative records). Example sources: IR Assessment, PRISM Assessment, Rapid assessment, Periodic Assessment, Admin Report, DHIS2, PRISM Ass - SBA, PRISM Ass - Penta 3, RDQA - comprehensive, RDQA - Verification, SOCI Assessment, DQR… etc.
-
Scope
- 📌 Field Name: Scope
-
🛠️ Selection Type: Dropdown Choose whether the data is for National or Regional reporting. If Regional, further selections will be required based on administrative levels = 1. List of Regions of Ethiopia will be available for selection on the dropdown field.
-
Region
- 📌 Field Name: Region
-
🛠️ Selection Type: Dropdown Determines if the data is entered for Regional level. Selection affects regional and facility-level reporting structures.
-
Health Administration Level
- 📌 Field Name: Health Administration Level
-
🛠️ Selection Type: Dropdown Determines if the data is entered for Woreda (District) or Zonal (Provincial) level. Selection affects regional and facility-level reporting structures.
-
Facility Type
- 📌 Field Name: Facility Type
-
🛠️ Selection Type: Dropdown Select the health facility type where the data was collected. Example facility types: Health Post, Health Center, Public HF, Private HF, PHCU, etc.
-
Period Type
- 📌 Field Name: Period Type
-
🛠️ Selection Type: Dropdown Select the reporting period format. Common period types include:
- Monthly | You will be prompted to select Months (January, February, March, ..)
- Quarterly | You will be prompted to select Quarters (Q1, Q2, Q3, Q4)
- Annual/Yearly | You will be prompted to select Years (2023, 2024, 2025, ..)
-
Gender/Sex
- 📌 Field Name: Gender/Sex
-
🛠️ Selection Type: Dropdown Select the gender category (if applicable). Options include: Male or Female.
-
Value
- 📌 Field Name: Value
- 🛠️ Input Type: Numeric Enter the actual numerical value for the indicator being reported. Ensure the value is accurate and within an acceptable range.
-
Data Representation
- 📌 Field Name: Data Representation
- 🛠️ Selection Type: Dropdown Select how the data should be represented:
- Number (Absolute Value) or Percent (Proportion)
5.10.3 Data Quality Assurance
Before submitting data, double-check the following: - ✅ Correct Indicator Selection: Ensure you are entering data for the intended indicator. - ✅ Accurate Data Source: Verify that the data source is appropriately selected. - ✅ Consistent Values: Check if values match historical trends and expected ranges. - ✅ Proper Data Representation: Confirm whether the data is in numbers or percentages. - ✅ Correct Administrative Levels: Ensure the data is assigned to the correct health administration level and facility type.
⚠️ Warning: Incorrect data entry can lead to inaccurate analysis and affect decision-making. If unsure, consult with a supervisor before finalizing the submission.
5.10.4 Saving and Adding New Data
Once all required fields are completed: - Click "Save" to store the data. - If additional records need to be entered, select "Add New" to clear the form and start a new entry. - Review the submitted data by navigating to the Data Review or Reports Section. [TBD]
5.10.5 Editing and Deleting Data
If you need to make changes, navigate to MOH Indicator Data Entry / Data Review, locate the entry, and select the checkbox you want to edit then click on Edit. To delete incorrect entries, use the Delete option. Only authorized users can modify or delete data entries. In this case, Data Manager or Administrator has privileges to alter any data entered.
5.10.6 Summary
- 🔹 The Data Entry Module is a critical component of the HISPMD, ensuring accurate and reliable data collection.
- 🔹 Users must follow the structured data entry process and verify inputs before submission.
- 🔹 Proper selection of indicators, data sources, administrative levels, and facility types is essential for accurate reporting.
- 🔹 Data quality assurance steps must be followed to maintain consistency and validity.
- 🔹 Users should always review and confirm data before finalizing the submission.
By following these guidelines, users can ensure the integrity of health performance monitoring data, leading to better decision-making and improved health system outcomes. 🚀
5.11 Setting Targets
The Setting Targets module in the Health Information Systems Performance Monitoring Dashboard (HISPMD) allows users to define performance targets for various health indicators. Establishing clear and realistic targets ensures effective health system planning, progress monitoring, and policy implementation. This section provides a step-by-step guide for setting targets for Ministry of Health (MOH) Indicators, including selecting indicators, defining baseline values, and specifying target years.
5.11.1 MOH Indicator Target Setting
The MOH Indicator Target Setting feature allows users to set performance targets based on historical data and strategic objectives. Before setting targets, ensure that you:
- ✅ Have accurate baseline values from verified sources.
- ✅ Understand the national and regional performance goals for the selected indicator.
- ✅ Are authorized to set targets based on your user role and permissions.
Steps to Set Targets
- Navigate to the Target Setting Page:
- Click on "MOH Indicators Target" in the main menu.
-
Select "Add New" from the available options.
-
Select the Indicator:
-
Choose the Indicator for which you want to set a target from the dropdown list. Example indicators include:
- HIS governance indexes
- Proportion of health facilities with a functional LAN system
- Reporting timeliness - Service Report
-
Review the Indicator Details:
-
Once selected, the system will display the following fields:
- Indicator Name (e.g., Reporting completeness - Representative - Service)
- Indicator Baseline (e.g., 98%)
- Indicator Baseline Year (e.g., 2024)
-
Set the Target Value:
-
Input the target value you aim to achieve (e.g., 100% for reporting completeness).
-
Select the Target Year:
-
Choose the year by which the target should be achieved (e.g., 2026).
-
Save the Target:
- Click the "Save" button to store the target value in the system.
-
A confirmation message will appear once the data is successfully recorded.
-
Review and Modify Targets:
- Navigate to the MoH Indicators Target section to verify and edit targets if necessary.
5.11.2 Target Setting Fields and Attributes
Each field in the target-setting module plays a crucial role in ensuring accurate and meaningful goal-setting. Below are the required fields and their descriptions:
- Indicator
- 📌 Field Name: Indicator
-
🛠️ Selection Type: Dropdown Select the health indicator from the available list. Examples include:
- HIS workforce core competency index
- Number of policy briefs prepared and submitted - HIS related
-
Indicator Baseline
- 📌 Field Name: Indicator Baseline
-
🛠️ Input Type: Numeric Displays the current performance level of the selected indicator (i.e., baseline data).
-
Target Value
- 📌 Field Name: Target Value
-
🛠️ Input Type: Numeric Enter the target value that you aim to achieve by the selected year.
-
Target Year
- 📌 Field Name: Target Year
- 🛠️ Selection Type: Dropdown Select the year for which the target will be evaluated.
End of Module
📌 NOTE: Some sections which say are for future implementation which have [TBD] to be determined | developed on top of the existing HISPMD. 📌